I’m not the only one disappointed in the way the web has worked out
in lots of ways. From <blink> onwards, so much semantic information is
missing from the average website, sometimes wilfully it appears. Why is
there so little structural data on what the components of a page are?
One particular peccadillo I dislike is “Previous/Next Page” elements on
a list page. Nobody ever uses
<a rel="next" ...>.
If you’re lucky, there’s an aria-label attribute for accessibility
purposes, but as it’s a free-form text, and there isn’t even a
convention, it could be pretty much anything.
For reasons unclear to me, almost no sites make use of the left/right
arrow keys for navigation. So if I want to map those keys to prev/next,
instead of a nice little bit of configuration, I have to resort to
this user
script:
(function() {
    'use strict';

    /* NB: we already tested for prefix/suffix, so this RE is OK. */
    function wholeWordMatch(haystack, needle) {
        let r = new RegExp("\\s" + needle + "\\s");
        return r.test(haystack);
    };

    const LEFT_KEY_CODE = 37;
    const RIGHT_KEY_CODE = 39;

    const prevStrings = [
        "previous page",
        "previous",
        "prev"
    ];

    const nextStrings = [
        "next page",
        "next"
    ];

    document.addEventListener("keyup", function(e) {

        if (!e) {
            e = window.event;
        }

        if (e.isComposing) {
            return;
        }

        switch (e.target.tagName) {
            case "TEXTAREA":
            case "INPUT":
                return;
        }

        const key = e.keyCode ? e.keyCode : e.which;

        var matches = undefined;

        if (key == LEFT_KEY_CODE) {
            matches = prevStrings;
        } else if (key == RIGHT_KEY_CODE) {
            matches = nextStrings;
        } else {
            return;
        }

        let found = undefined;
        let score = 0;

        document.querySelectorAll("a").forEach((link) => {
            let strs = [ link.textContent ];

            if (!link.href) {
                return;
            }

            /* This is often a good match if the text itself isn't. */
            if (link.attributes["aria-label"]) {
                strs.push(link.attributes["aria-label"].nodeValue);
            }

            for (let str of strs) {
                if (typeof str === "undefined") {
                    return;
                }

                str = str.toLowerCase();

                /*
                 * There's no perfect way to find the "best" link, but in
                 * practice this works on a reasonable number of sites: an exact
                 * match, or exact prefix or suffix, always wins; otherwise, we
                 * match a whole-word sub-string: "Go to prev <<" will match,
                 * but not "dpreview.com".
                 */
                for (let match of matches) {
                    if (str === match) {
                        found = link;
                        break;
                    }

                    if (str.startsWith(match) || str.endsWith(match)) {
                        found = link;
                        break;
                    }

                    if (score < 1 && wholeWordMatch(str, match)) {
                        found = link;
                        score = 1;
                    }
                }
            }
        });

        if (found) {
            found.click();
        }

  }, true);
})();
Yet again, hacky, but it mostly works. It’s pretty cool that this is
even possible though.
We have what should be a simple task: we’re on CentOS 7, and we want to
deploy a Go binary that will have USDT
tracepoints. USDT is an attractive
option for a few debugging purposes. It allows applications to define
tracepoints with higher levels of stability and semantic meaning than
more ad-hoc methods like dynamic uprobes.
Usage of USDT tracepoints tends to have a different focus from other
monitoring techniques like logging, Prometheus, OpenTracing etc. These
might identify a general issue such as a poor latency metric: you’d then
use USDT probes to dig further into the problems in a production system,
to identify precisely what’s happening at a particular endpoint or
whatever.
USDT in Go
The normal model for USDT involves placing the trace points at specific
places in the binary: they are statically defined and built, but
dynamically enabled. This is typically done via the DTRACE_PROBE()
family of macros.
The only (?) USDT facility for Go is
salp. This uses
libstapsdt under the hood. This
library dynamically creates probes at runtime, even though Go is a
compiled language. Yes, this is dynamic static dynamic tracing.
We’re going to use salpdemo in our experiment. This has two USDT
probes, p1 and p2 that we’d like to be able to dynamically trace,
using bcc-tools' handy trace wrapper. CentOS 7 doesn’t appear to have
support for the later USDT support in perf probe.
Setting up a Docker container for dynamic tracing
For a few different reasons, we’d like to be able to trace from inside
the container itself. This has security implications, given what’s
implemented today, but bear in mind we’re on CentOS 7, so even if
there’s a finer-grained current solution, there’s a good chance it
wouldn’t work here. In reality, we would probably use an ad-hoc
debugging sidecar container, but we’re going to just use the one
container here.
First, we’re going to deploy the container with ansible for
convenience:
$ cat hosts
localhost ansible_connection=local
$ cat playbook.yml
---

- hosts: localhost
  become: yes
  tasks:
    - docker_container:
        name: usdt_test
        image: centos:7
        state: started
        command: sleep infinity
        network_mode: bridge
        ulimits:
          - memlock:8192000:8192000
        capabilities:
          - sys_admin
        volumes:
          - /sys/kernel/debug:/sys/kernel/debug
$ ansible-playbook -i hosts ./playbook.yml
Note that we’re using sleep infinity here to keep our container
running so we can play around.
We need the sys_admin capability to be able to program the probes,
and the BPF compiler needs the locked memory limit bumping. We also
need to mount /sys/kernel/debug read-write (!) in order to be able to
write to /sys/kernel/debug/tracing/uprobe_events.
Now let’s install everything we need to be able to trace these probes:
$ docker exec -it usdt_test yum -y install \
    kernel-devel-$(uname -r) kernel-$(uname -r) bcc-tools
Yes, it’s a lot, but unavoidable. You can, in theory, use mounted
volumes for the kernel sources, as described
here;
however, the read-only mounts break packaging inside the container, so
we’re not doing that here.
Tracing the probes in the container
The above was a big hammer, but we should be good to go right? Let’s
start up the demo binary:
$ docker cp ~/salpdemo usdt_test:/root/
$ docker exec -it usdt_test bash
[root@8ccf34663dd2 /]# ~/salpdemo &
[1] 18166
 List the go probes in this demo with
	sudo tplist -vp "$(pgrep salpdemo)" "salp-demo*"
Trace this process with
	sudo trace -p "$(pgrep salpdemo | head -n1)" 'u::p1 "i=%d err=`%s` date=`%s`", arg1, arg2, arg3' 'u::p2 "j=%d flag=%d", arg1, arg2'
	or
	sudo trace -p "$(pgrep salpdemo | head -n1)" 'u::p1 (arg1 % 2 == 0) "i=%d err='%s'", arg1, arg2'
We can indeed list the probes:
[root@8ccf34663dd2 /]# /usr/share/bcc/tools/tplist -vp $(pgrep salpdemo) | head
salp-demo:p1 [sema 0x0]
  1 location(s)
  3 argument(s)
salp-demo:p2 [sema 0x0]
  1 location(s)
  2 argument(s)
libc:setjmp [sema 0x0]
...
So let’s try the suggested trace invocation:
# /usr/share/bcc/tools/trace -p "$(pgrep salpdemo | head -n1)" 'u::p1 (arg1 % 2 == 0) "i=%d err='%s'", arg1, arg2'

perf_event_open(/sys/kernel/debug/tracing/events/uprobes/p__tmp_salp_demo_I8qitQ_so_0x270_18166_bcc_18175/id): Invalid argument
Failed to attach BPF to uprobe
Huh. This doesn’t seem to be a permissions issue, since we got EINVAL.
In addition, running from the host has the same problem.
I haven’t proved it, but I think our basic issue here is that Centos 7
is missing this kernel fix:
tracing/uprobe: Add support for overlayfs
I spent way too long trying to work around this by placing the binary
somewhere other than overlayfs, before I finally dug a little bit more
into how libstapsdt actually works, and figured out the problem.
Working around overlayfs and libstapsdt
To build probes dynamically at runtime, libstapsdt does something
slightly
crazy:
it generates a temporay ELF shared library at runtime that contains
the USDT probes and uses dlopen() to bring it into the running binary.
Let’s have a look:
[root@8ccf34663dd2 /]# grep salp-demo /proc/$(pgrep salpdemo)/maps
7fa9373b5000-7fa9373b6000 r-xp 00000000 fd:10 1506373                    /tmp/salp-demo-I8qitQ.so
7fa9373b6000-7fa9375b5000 ---p 00001000 fd:10 1506373                    /tmp/salp-demo-I8qitQ.so
7fa9375b5000-7fa9375b6000 rwxp 00000000 fd:10 1506373                    /tmp/salp-demo-I8qitQ.so
The process has mapped in this temporary file, named after the provider.
It’s on /tmp, hence overlay2 filesystem, explaining why moving the
salpdemo binary itself around made no difference.
So maybe we can be more specific?
[root@8ccf34663dd2 /]# /usr/share/bcc/tools/trace -p "$(pgrep salpdemo | head -n1)" 'u:/tmp/salp-demo-I8qitQ.so:p1 (arg1 % 2 == 0) "i=%d err='%s'", arg1, arg2'
perf_event_open(/sys/kernel/debug/tracing/events/uprobes/p__tmp_salp_demo_I8qitQ_so_0x270_18166_bcc_18188/id): Invalid argument
Failed to attach BPF to uprobe
Still not there yet. The above bug means that it still can’t find the
uprobe given the binary image path. What we really need is the host
path of this file. We can get this from Docker:
$ docker inspect usdt_test | json -a GraphDriver.Data.MergedDir
/data/docker/overlay2/77c1397db72a7f3c7ba3f8af6c5b3824dc9c2ace9432be0b0431a2032ea93bce/merged
This is not good, as obviously we can’t reach this path from inside the
container. Hey, at least we can run it on the host though.
$ sudo /usr/share/bcc/tools/trace 'u:/data/docker/overlay2/77c1397db72a7f3c7ba3f8af6c5b3824dc9c2ace9432be0b0431a2032ea93bce/merged/tmp/salp-demo-I8qitQ.so:p1 (arg1 % 2 == 0) "i=%d err='%s'", arg1, arg2'
Event name (p__data_docker_overlay2_77c1397db72a7f3c7ba3f8af6c5b3824dc9c2ace9432be0b0431a2032ea93bce_merged_tmp_salp_demo_I8qitQ_so_0x270) is too long for buffer
Failed to attach BPF to uprobe
SIGH. Luckily, though:
$ sudo /usr/share/bcc/tools/trace 'u:/data/docker/overlay2/77c1397db72a7f3c7ba3f8af6c5b3824dc9c2ace9432be0b0431a2032ea93bce/diff/tmp/salp-demo-I8qitQ.so:p1 (arg1 % 2 == 0) "i=%d err='%s'", arg1, arg2'
PID     TID     COMM            FUNC             -
19862   19864   salpdemo        p1               i=64 err=An error: 64
19862   19864   salpdemo        p1               i=66 err=An error: 66
It worked! But it’s not so great: we wanted to be able to trace inside a
container. If we mounted /data/docker itself inside the container, we
could do that, but it’s still incredibly awkward.
Using tmpfs?
Instead, can we get the generated file onto a different filesystem type?
libstapsdt hard-codes
/tmp
which limits our options.
Let’s start again with /tmp inside the container on tmpfs:
$ tail -1 playbook.yml
        tmpfs: /tmp:exec
We need to force on exec mount flag here: otherwise, we can’t
dlopen() the generated file. Yes, not great for security again.
$ docker exec -it usdt_test bash
# ~/salpdemo &
...
[root@1f56af6e7bee /]# /usr/share/bcc/tools/trace -p "$(pgrep salpdemo | head -n1)" 'u::p1 "i=%d err=`%s` date=`%s`", arg1, arg2, arg3' 'u::p2 "j=%d flag=%d", arg1, arg2'
PID     TID     COMM            FUNC             -
Well, we’re sort of there. It started up, but we never get any output.
Worse, we get the same if we try this in the host now! I don’t know
what the issue here is.
Using a volume?
Let’s try a volume mount instead:
$ tail -3 playbook.yml
        volumes:
          - /sys/kernel/debug:/sys/kernel/debug
          - /tmp/tmp.usdt_test:/tmp
If we run trace in the host now, we can just use u::p1:
$ sudo /usr/share/bcc/tools/trace -p "$(pgrep salpdemo | head -n1)" 'u::p1 "i=%d err=`%s` date=`%s`", arg1, arg2, arg3' 'u::p2 "j=%d flag=%d", arg1, arg2'
PID     TID     COMM            FUNC             -
6864    6866    salpdemo        p2               j=120 flag=1
...
But we still need a bit of a tweak inside our container:
# /usr/share/bcc/tools/trace -p "$(pgrep salpdemo | head -n1)" 'u::p1 "i=%d err=`%s` date=`%s`", arg1, arg2, arg3'
PID     TID     COMM            FUNC             -
<no output>
[root@d72b822cab0f /]# cat /proc/$(pgrep salpdemo | head -n1)/maps | grep /tmp/salp-demo*.so | awk '{print $6}' | head -n1
/tmp/salp-demo-6kcugm.so
[root@d72b822cab0f /]# /usr/share/bcc/tools/trace -p  "$(pgrep salpdemo | head -n1)" 'u:/tmp/salp-demo-6kcugm.so:p1 "i=%d err=`%s` date=`%s`", arg1, arg2, arg3'
PID     TID     COMM            FUNC             -
11593   11595   salpdemo        p1               i=-17 err=`An error: -17` date=`Thu, 06 Aug 2020 13:12:57 +0000`
...
I don’t have any clear idea why the name is required inside the
container context, but at least, finally, we managed to trace those USDT
probes!
Going to the first matching tag in vim with Control-] can be rather
annoying. The exuberant-ctags secondary sort key is the filename, not
the tag kind. If you have a struct type that’s also a common member
name, you’re forced into using :tselect to find the struct instead of
all the members. Most of the time, the struct definition is what you
want.
To avoid this issue, I sort the tags file such that any kind == "s"
entries come first for that tag. It’s a little annoying due to the
format of the file, but it does work:
#!/bin/bash

# ctags, but sub-sorted such that "struct request" comes first, rather than
# members with the same name.

# we can't use "-f -", as that elides the TAG_FILE_SORTED preamble
ctags -R -f tags.$$

awk '
BEGIN {
	FS="\t"
	entry=""
	struct=""
	buf=""
}

$1 != entry {
	if (entry != "") {
		printf("%s%s", struct, buf);
	}
	entry=$1;
	struct="";
	buf="";
}

/^.*"\ts/ {
	struct=struct $0 "\n"
	next
}

$1 == entry {
	buf=buf $0 "\n"
}

END {
	printf("%s%s", struct, buf);
}' <tags.$$ >tags

rm tags.$$
With all this free time I finally got around to installing a doorbell at
home. I had no interest in Ring or the like: what I really wanted was a
simple push doorbell that fit the (Victorian) house but would also
somehow notify me if I was downstairs…
There are several documented projects on splicing in a Raspberry Pi into
existing powered doorbell systems, but that wasn’t what I wanted either.
Instead, the doorbell is a simple contact switch feeding into the Pi’s
GPIO pins. It’s effectively extremely simple but I didn’t find a step by
step, so this is what I could have done with reading.
I bought the Pi, a case, a power supply, an SD card, and a USB speaker:

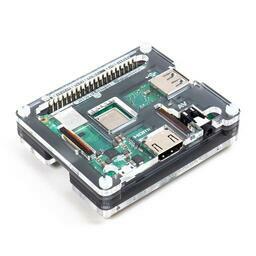


And the doorbell itself plus wiring:


I bought a pre-installed Raspbian SD card as I don’t have an SD card
caddy. After some basic configuration (which required HDMI over to a
monitor) I started playing with how to set up the Pi.
Of course the PI is absurdly over-powered for this purpose, but I wanted
something simple to play with. And anyway, it’s running Pihole too.
The wiring itself is simple: bell wire over through a hole in the door
frame to the back of the doorbell (which is a simple contact push). The
other end of the wires are connected to the PI’s GPIO pin 18, and
ground.
The pin is pulled up and we trigger the event when we see a falling
edge.
Actually connecting the wires was a bit fiddly: the bell wire is too
thin for the 0.1" connector, and lacking a proper crimping tool I had to
bodge it with needle-nose pliers. But once in the pins the housing
connection is solid enough.
At first I tried to connect it to Alexa but soon gave up on that idea.
There’s no way to “announce” via any API, and it kept disconnecting when
used as a Bluetooth speaker. And Alexa has that infuriating “Now playing
from…” thing you can’t turn off as well.
During fiddling with this I removed PulseAudio from the Pi as a dead
loss.
Nor could I use an Anker Soundcore as a Bluetooth speaker: the stupid
thing has some sleep mode that means it misses off the first 3 seconds
or so of whatever’s playing.
Instead I have the USB speaker above. It’s not great but is enough to be
heard from outside and inside.
Aside from playing whatever through the speaker, the bell notifies my
desktop as well as sending an email. Here’s the somewhat crappy script
it’s running:
#!/usr/bin/python3 -u

#
# Not going to win any awards this one, is it?
#
# The Pi is wired up such that pin 18 goes through the switch to ground.
# The on-pin pull-up resistor is enabled (so .input() is normally True).
# When the circuit completes, it goes to ground and hence we get a
# falling edge and .input() becomes False.
#
# I get the occasional phantom still so we wait for settle_time before
# thinking it's real.
#

from email.mime.text import MIMEText
from subprocess import Popen, PIPE
from datetime import datetime

import RPi.GPIO as GPIO
import subprocess
import alsaaudio
import threading
import signal
import wave
import time
import sys
import os

samplefile = sys.argv[1]
device='plughw:1,0'

# in seconds
settle_time = 0.1
bounce_time = 1

active = False

def notify():
    subprocess.run(['/home/pi/notify-sent'])

    msg = MIMEText('At %s' % datetime.now().strftime('%Y-%m-%d %H:%M:%S'))
    msg['From'] = 'doorbell <[email protected]>'
    msg['To'] = 'John Levon <[email protected]>'
    msg['Subject'] = 'Someone is ringing the doorbell'

    p = Popen(['/usr/sbin/sendmail', '-f', '[email protected]', '-t', '-oi'], stdin=PIPE)
    p.stdin.write(msg.as_string().encode())
    p.stdin.close()

def play():
    global samplefile
    global active

    active = True
    count = 0

    with wave.open(samplefile) as f:

        format = None

        # 8bit is unsigned in wav files
        if f.getsampwidth() == 1:
            format = alsaaudio.PCM_FORMAT_U8
        # Otherwise we assume signed data, little endian
        elif f.getsampwidth() == 2:
            format = alsaaudio.PCM_FORMAT_S16_LE
        elif f.getsampwidth() == 3:
            format = alsaaudio.PCM_FORMAT_S24_3LE
        elif f.getsampwidth() == 4:
            format = alsaaudio.PCM_FORMAT_S32_LE
        else:
            raise ValueError('Unsupported format')

        rate = f.getframerate()

        periodsize = rate // 8

        out = alsaaudio.PCM(alsaaudio.PCM_PLAYBACK, device=device)
        out.setchannels(f.getnchannels())
        out.setrate(rate)
        out.setformat(format)
        out.setperiodsize(periodsize)

        # We always play at least one time round...
        while active or count < 1:
            data = f.readframes(periodsize)

            if data:
                out.write(data)
            else:
                print('looping after %d plays, active %s' % (count, active))
                count += 1
                f.rewind()

        print('pausing audio')
        out.pause()

    print('stopped after %d plays' % count)

def wait():
    global active

    while True:
        input_state = GPIO.input(18)
        if input_state:
            print('got input_state %s, active -> False' % input_state)
            active = False
            break
        time.sleep(0.2)

def trigger():
    print('triggering at %s' % time.time())

    tn = threading.Thread(target=notify)
    tn.start()

    tp = threading.Thread(target=play)
    tp.start()

    tw = threading.Thread(target=wait)
    tw.start()

    tw.join()
    tp.join()
    tn.join()

def settle():
    global settle_time
    time.sleep(settle_time)
    input_state = GPIO.input(18)
    print('input state now %s' % input_state)
    return not input_state

def falling_edge(channel):
    input_state = GPIO.input(18)
    print('got falling edge, input_state %s' % input_state)
    if settle():
        trigger()

with wave.open(samplefile) as f:
    # things go horrible if the rate isn't 48000 for some reason
    if f.getframerate() != 48000:
        raise ValueError('file must be 48000 rate')
    if f.getsampwidth() not in [ 1, 2, 3, 4]:
            raise ValueError('Unsupported format')

GPIO.setmode(GPIO.BCM)
GPIO.setup(18, GPIO.IN, pull_up_down=GPIO.PUD_UP)
GPIO.add_event_detect(18, GPIO.FALLING, callback=falling_edge, bouncetime=(bounce_time * 1000))

print('started')

signal.pause()
For some time now, gnome-terminal amongst others has had a heuristic
that guesses at URLs, and allows you to control-click to directly open
it. However, this was easily foxed by applications doing line-wrapping
instead of letting the terminal do so.
A few years ago, gnome-terminal gained ANSI escape sequences for URL
highlighting.
It requires applications to output the necessary escape codes, but works
far more reliably.
Annoyingly, you still need to control-click, but that is easily
fixed.
I rebuilt Ubuntu’s build with this change like so:
sudo apt build-dep gnome-terminal
apt source gnome-terminal
cd gnome-terminal-3.28.2
dpkg-buildpackage --no-sign -b
sudo dpkg -i ../gnome-terminal_3.28.2-1ubuntu1~18.04.1_amd64.deb
This would be most useful if mutt supported the sequences, but
unfortunately its built-in pager is stuck behind libncurses and can’t
easily get out from under it. Using an external pager with mutt is not
great either, as you lose all the integration.
There’s also no support in
w3m. Even though it
thankfully avoids libncurses, it’s a bit of a pain to implement, as
instead of just needing to track individual bits for bold on/off or
whatever, there’s a whole URL target that needs mapping onto the
(re)drawn screen lines.
So instead there’s the somewhat ersatz:
$ grep email-html ~/.muttrc
macro pager,index,attach k "<pipe-message>email-html<Enter>"
where
$ cat email-html
#!/bin/bash

dir=$(mktemp -d -p /tmp)

ripmime -i - -d $dir --name-by-type

cat $dir/text-html* | w3m -no-mouse -o display_link \
    -o display_link_number -T text/html | \
    sed 's!https*://.*!\x1B]8;;&\x1B\\&\x1B]8;;\x1B\\!g' | less -rX

rm -rf $dir
It’ll have to do.
With my Coronavirus-related CFT I finally got around to migrating off
Blogger. I lost comments, but I think I’ll probably keep it like that:
there’s twitter, and Blogger’s anti-spam facilities were pretty much
hopeless.
My first attempt used jekyll. I
suppose this works best with Github Pages, because I gave up on it
pretty quickly: various irritating Ruby version incompatibilities,
random tracebacks from modules, import not working well at all etc.
Next stop was hugo which was much, much
nicer. Although it was still a little tedious to import (there’s not
really integration, so you need 3rd party tools like the one I used
to import the Blogger content -
blog2md).
The base theme I ended up using was Strange
Case. Having battled with
impenetrable Wordpress themes in the past, it was refreshing to be able
to modify something so eminently hackable, and being based on the
familiar bootstrap was a big plus as well.
It took me a while to fix up a few things (like making Recent Posts
show only posts, instead of all pages), and getting used to the way
hugo searches the layout files took a bit of time, but it was all in all
a good experience.
It seemed a little tricky to create all the necessary 301 Redirect
directives for the old Blogger-style permalinks, so I crapped out and
just manually added a few that I know people might actually want to find
via Google.
I spent far too long trying to find an Atom feed importer for my old
Sun blog.
Seems like there isn’t a general one, so I threw
roller2hugo together instead,
which works just enough.
I’m the old-fashioned type who still likes getting email: I can process
it at my leisure while still handling high volume. Unfortunately github
itself can’t email you when commits are made to a particular repo
(unless you own it and can configure hooks). So I need to resort to the
atom feeds, and rss2email:
$ r2e new [email protected]
$ vi .rss2email/config.py
   # set local (sendmail) delivery, disable HTML mail, etc.
$ r2e opmlimport subscriptions.xml
$ declare -f github-commits
github-commits ()
{
    r2e add $(basename $1) "https://github.com/$1/commits/master.atom"
}
$ crontab -l | grep r2e
*/10 * * * * r2e run
$ tail -3 .procmailrc
:0
* User-Agent: rss2email
commits/
So every 10 minutes, we’ll get new commits from all the watched repos,
and procmail them into a commits folder.
With the number of repos I’m watching, I have to set:
same-server-fetch-interval = 0.5
in the configuration to stop github throwing back 429 Too Many Requests at me.
Private repositories
It’s pretty ghetto, but if you look at the source for
https://github.com/me/privaterepo/commits/master, you’ll find an Atom
link including a token that you can use for getting notifications from
private repos. At least you’re not handing it off to a third-party like
IFTT with the above approach…
I just published new version of
zoom-lomax. This is updated to use
the v2 Zoom API, as v1 is going away at some point.
I run this every night so I can catch up on any meetings outside of my
normal timezone the next day; it’s proven very useful for me.
Newer versions of Gerrit, somewhat insanely, lack the old “Open All”
button to open each file in its own tab. Here’s a bookmarklet that does
so:
javascript: (
  function() {
    var dl = document.querySelectorAll(".pathLink");

    if (!dl.length) {
      dl = document.querySelectorAll("a.gr-file-list");
    }

    if (!dl.length) {
      dl = document.querySelectorAll(".path");
    }

    if (!dl.length) {
      dl = document.querySelectorAll(".com-google-gerrit-client-change-FileTable-FileTableCss-pathColumn > a");
    }

    if (!dl.length) {
      dl = document.querySelector('body > gr-app')
           .shadowRoot.querySelector('gr-app-element')
           .shadowRoot.querySelector('gr-change-view')
           .shadowRoot.querySelector('gr-file-list')
           .shadowRoot.querySelectorAll('.pathLink');
    }

    if (!dl.length) {
      alert('no links');
    } else {
      if (confirm('Open ' + dl.length + ' links in new windows?')) {
        for (var i = 0; i < dl.length; ++i) {
          window.open(dl[i].href);
        }
      }
    }
  }
)();
(Add the above as the “Location” of a bookmark.) If somebody knows a
less shitty way to traverse all the new shadow roots, I’d love to hear
it.
- 2021-01-27: updated to fix a javascript error
- 2021-02-09: updated for some other gerrit versions
- 2021-06-17: updated for yet another gerrit version
I found it a little bit non-obvious how to use
NAPI to add an external NIC to
a compute node so it can reach the external network rather than just the
internal admin one.
We need to first tag the underlying physical NIC on the compute node
with the externalNIC tag. We need to look up the MAC of the physical
NIC:
computenode# # dladm show-phys -m ixgbe0
LINK         SLOT     ADDRESS            INUSE CLIENT
ixgbe0       primary  e4:11:5b:97:83:49  yes  ixgbe0
then tell NAPI (from the headnode) that this NIC is going to provide the
external tag:
sdc-napi /nics/e4:11:5b:97:83:49 -X PUT -d '{ "nic_tags_provided" : "external" }'
We now need to actually add the external VNIC in NAPI:
cn=*your compute node UUID from `sdc-server list`*
ip=*IP address to use on external network*
vlan_id=*vlan id if any*

owner=$(sdc-useradm get admin | json uuid)

sdc-napi /nics -X POST -d @- <<EOF
{
 "owner_uuid": "$owner",
 "belongs_to_type": "server",
 "belongs_to_uuid": "$cn",
 "cn_uuid": "$cn",
 "ip": "$ip",
 "vlan_id": "$vlan_id",
 "nic_tag": "external"
}
EOF
After a while, we should find that the DHCPD server has updated the
networking config file for the CN:
# cat /zones/$(vmadm list -Ho uuid alias=dhcpd0)/root/tftpboot/bootfs/e4115b978348/networking.json
...
  "nictags": [
    {
      "mtu": 1500,
      "name": "external",
      "uuid": "86b73953-488a-4041-bd7a-83aa51c4ca22"
...
  "vnics": [
...
      "belongs_to_type": "server",
      "nic_tag": "external",
...
And on rebooting the CN, we can find our interface up, and reachable
externally:
# ipadm show-addr external0/_a
ADDROBJ           TYPE     STATE        ADDR
external0/_a      static   ok           192.168.0.44/24