The recent release of QEMU
10.1
now comes with its very own vfio-user client. You can try this out yourself
relatively easily -
please give it a go!
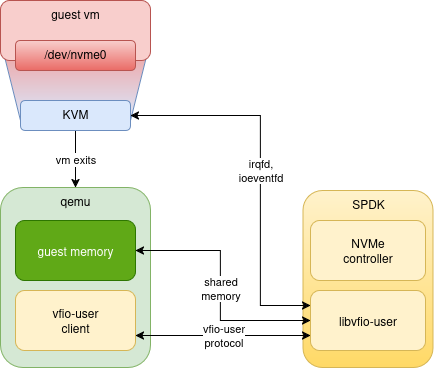
vfio-user is a framework that allows implementing PCI devices in userspace.
Clients (such as QEMU) talk the vfio-user protocol over a UNIX socket to a
device server; it looks something like this:
To implement a virtual device for a guest VM, there are generally two parts
required: “frontend” driver code in the guest VM, and a “backend” device
implementation.
The driver is usually - but by no means always - implemented in the guest OS
kernel, and can be the same driver real hardware uses (such as a SATA
controller), or something special for a virtualized platform (such as
virtio-blk).
The job of the backend device implementation is to emulate the device in various
ways: respond to register accesses, handle mappings, inject interrupts, and so
on.
An alternative to virtual devices are so-called “passthrough” devices, which
provide a thin virtualization layer on top of a real physical device, such as an
SR-IOV Virtual Function from a physical NIC. For PCI devices, these are
typically handled via the VFIO
framework.
Other backend implementations can live in all sorts of different places: the
host kernel, the emulator process, a hardware device, and so on.
For various reasons, we might want a userspace software device implementation,
but not as part of the VMM process (such as QEMU) itself.
The rationale
For virtio-based devices, such “out of process device emulation” is usually done via
vhost-user.
This allows a device implementation to exist in a separate process,
shuttling the necessary messages, file descriptors, and shared mappings between
QEMU and the server.
However, this protocol is specific to virtio devices such as virtio-net and
so on. What if we wanted a more generic device implementation framework? This is
what vfio-user is for.
It is explicitly modelled on the vfio interface used for communication between
QEMU and the Linux kernel vfio driver, but it has no kernel component: it’s
all done in userspace. One way to think of vfio-user is that it smushes
vhost-user and vfio together.
In the diagram above, we would expect much of the device setup and management to
happen via vfio-user messages on the UNIX socket connecting the client to the
server SPDK process: this part of the system is often referred to as the
“control plane”. Once a device is set up, it is ready to handle I/O requests -
the “data plane”. For performance reasons, this is often done via sharing device
memory with the VM, and/or guest memory with the device. Both vhost-user and
vfio-user support this kind of sharing, by passing file descriptors to
mmap() across the UNIX socket.
libvfio-user
While it’s entirely possible to implement a vfio-user server from scratch, we
have implemented a C library to make
this easier: this handles the basics of implementing a typical PCI device,
allowing device implementers to focus on the specifics of the emulation.
SPDK
At Nutanix, one of the main reasons we were interested in building all this was
to implement virtual storage using the NVMe protocol. To do this we make use of
SPDK. SPDK’s NVMe support was originally designed for use in
a storage server context (NVMe over Fabrics). As it happens, there are lots of
similarities between such a server, and how an NVMe PCI controller needs to work
internally.
By re-using this nvmf subsystem in SPDK, alongside libvfio-user, we can
emulate a high-performance virtualized NVMe controller for use by a VM. From the
guest VM’s operating system, it looks just like a “real” NVMe card, but on the
host, it’s using the vfio-user protocol along with memory sharing, ioeventfds,
irqfds, etc. to talk to an SPDK server.
The Credits
While I was responsible for getting QEMU’s vfio-user client upstreamed, I was
by no means the only person involved. My series was heavily based upon previous
work by Oracle by John Johnson and others, and the original work on vfio-user
in general was done by Thanos Makatos, Swapnil Ingle, and several others. And
big thanks to Cédric Le Goater for all the reviews and help getting the series
merged.
Further Work
While the current implementation is working well in general, there’s an awful
lot more we could be doing. The client side has enough implemented to cover our
immediate needs, but undoubtedly there are other implementations that need
extensions. The libvfio-user issues
tracker
captures a lot of the generic protocol work as well some library-specific
issues. In terms of virtual NVMe itself, we have lots of ideas for how to
improve the SPDK implementation, across performance, correctness, and
functionality.
There is an awful lot more I could talk about here about how this all works
“under the hood”; perhaps I will find time to write some more blog posts…
The meme is real, but I think this particular case is sort of interesting,
because it turned out, ultimately, to not be due to DNS configuration, but an
honest-to-goodness bug in glibc.
As previously
mentioned, I
heavily rely on email-oauth2-proxy for my work
email. Every now and then, I’d see a failure like this:
Email OAuth 2.0 Proxy: Caught network error in IMAP server at [::]:1993 (unsecured) proxying outlook.office365.com:993 (SSL/TLS) - is there a network connection? Error type <class 'socket.gaierror'> with message: [Errno -2] Name or service not known
This always coincided with a change in my network, but - and this is the issue -
the app never recovered. Even though other processes - even Python ones - could
happily resolve outlook.office365.com - this long-running daemon remained
stuck, until it was restarted.
A bug in the proxy?
My first suspect here was this bit of code:
1761     def create_socket(self, socket_family=socket.AF_UNSPEC, socket_type=socket.SOCK_STREAM):
1762         # connect to whichever resolved IPv4 or IPv6 address is returned first by the system
1763         for a in socket.getaddrinfo(self.server_address[0], self.server_address[1], socket_family, socket.SOCK_STREAM):
1764             super().create_socket(a[0], socket.SOCK_STREAM)
1765             return
We’re looping across the gai results, but returning after the first one, and
there’s no attempt to account for the first address result being unreachable,
but later ones being fine.
Makes no sense, right? My guess was that somehow getaddrinfo() was returning
IPv6 results first in this list, as at the time, the IPv6 configuration on the
host was a little wonky. Perhaps I needed to tweak
gai.conf ?
However, while this was a proxy bug,
it was not the cause of my issue.
DNS caching?
Perhaps, then, this is a local DNS cache issue? Other processes work OK, even
Python test programs, so it didn’t seem likely to be the system-level resolver
caching stale results. Python itself doesn’t seem to cache
results.
This case triggered (sometimes) when my VPN connection died. The openconnect
vpnc script had correctly updated /etc/resolv.conf back
to the original configuration, and as there’s no caching in the way, then the
overall system state looked correct. But somehow, this process still had wonky
DNS?
A live reproduction
I was not going to get any further until I had a live reproduction and
the spare time to investigate it before restarting the proxy.
The running proxy in this state could be triggered easily by waking up
fetchmail, which made it much easier to investigate what was happening each
time.
So what was the proxy doing on line :1763 above? Here’s an strace snippet:
[pid  1552] socket(AF_INET, SOCK_DGRAM|SOCK_CLOEXEC|SOCK_NONBLOCK, IPPROTO_IP) = 7
[pid  1552] setsockopt(7, SOL_IP, IP_RECVERR, [1], 4) = 0
[pid  1552] connect(7, {sa_family=AF_INET, sin_port=htons(53), sin_addr=inet_addr("ELIDED")}, 16) = 0
[pid  1552] poll([{fd=7, events=POLLOUT}], 1, 0) = 1 ([{fd=7, revents=POLLOUT}])
[pid  1552] sendto(7, "\250\227\1 \0\1\0\0\0\0\0\1\7outlook\toffice365\3c"..., 50, MSG_NOSIGNAL, NULL, 0) = 50
[pid  1552] poll([{fd=7, events=POLLIN}], 1, 5000) = 1 ([{fd=7, revents=POLLERR}])
[pid  1552] close(7)                    = 0
As we might expect, we’re opening a socket, connecting over UDP to port 53,
and sending out a request to the DNS server.
This indicated the proximal issue: the DNS server IP address was wrong - the
DNS servers used were the ones originally set up by openconnect still. The
process wasn’t incorrectly caching DNS results but the DNS servers. Forever.
Nameserver configuration itself is not something that applications typically
control, so the next question was - how does this work normally? When I update
/etc/resolv.conf, or the thousand other ways to configure name resolution in
modern Linux systems, what makes getaddrinfo() continue to work, normally?
/etc/resolv.conf and glibc
So, how does glibc account for changes in resolver configuration?
The contents of the /etc/resolv.conf file are the canonical location for
DNS server addresses for processes (like Python ones) using the standard glibc
resolver. Logically then, there must be a way for updates to the file to affect
running processes.
In glibc, such configuration is represented by struct resolv_context. This
is lazily initialized via __resolv_context_get()->maybe_init(), which looks
like
this:
 68 /* Initialize *RESP if RES_INIT is not yet set in RESP->options, or if
 69    res_init in some other thread requested re-initializing.  */
 70 static __attribute__ ((warn_unused_result)) bool
 71 maybe_init (struct resolv_context *ctx, bool preinit)
 72 {
 73   struct __res_state *resp = ctx->resp;
 74   if (resp->options & RES_INIT)
 75     {
 76       if (resp->options & RES_NORELOAD)
 77         /* Configuration reloading was explicitly disabled.  */
 78         return true;
 79
 80       /* If there is no associated resolv_conf object despite the
 81          initialization, something modified *ctx->resp.  Do not
 82          override those changes.  */
 83       if (ctx->conf != NULL && replicated_configuration_matches (ctx))
 84         {
 85           struct resolv_conf *current = __resolv_conf_get_current ();
 86           if (current == NULL)
 87             return false;
 88
 89           /* Check if the configuration changed.  */
 90           if (current != ctx->conf)
...
Let’s take a look at __resolv_conf_get_current():
123 struct resolv_conf *
124 __resolv_conf_get_current (void)
125 {
126   struct file_change_detection initial;
127   if (!__file_change_detection_for_path (&initial, _PATH_RESCONF))
128     return NULL;
129
130   struct resolv_conf_global *global_copy = get_locked_global ();
131   if (global_copy == NULL)
132     return NULL;
133   struct resolv_conf *conf;
134   if (global_copy->conf_current != NULL
135       && __file_is_unchanged (&initial, &global_copy->file_resolve_conf))
This is the file change detection code we’re looking for: _PATH_RESCONF is
/etc/resolv.conf, and __file_is_unchanged() compares the cached values of
things like the file mtime and so on against the one on disk.
If it has in fact changed, then maybe_init() is supposed to go down the
“reload configuration” path.
Now, in my case, this wasn’t happening. And the reason for this is line 83
above: the replicated_configuration_matches() call.
Resolution options
We already briefly mentioned
gai.conf. There is
also, as the resolver.3 man
page says, this
interface:
The resolver routines use configuration and state information
contained in a __res_state structure (either passed as the statep
argument, or in the global variable _res, in the case of the
older nonreentrant functions).  The only field of this structure
that is normally manipulated by the user is the options field.
So an application can dynamically alter options too, outside of whatever
static configuration there is. And (I think) that’s why we have the
replicated_configuration_matches() check:
static bool
replicated_configuration_matches (const struct resolv_context *ctx)
{
  return ctx->resp->options == ctx->conf->options
    && ctx->resp->retrans == ctx->conf->retrans
    && ctx->resp->retry == ctx->conf->retry
    && ctx->resp->ndots == ctx->conf->ndots;
}
The idea being, if the application has explicitly diverged its options, it
doesn’t want them to be reverted just because the static configuration changed.
Our Python application isn’t changing anything here, so this should still
work as expected.
In fact, though, we find that it’s returning false: the dynamic configuration
has somehow acquired the extra options RES_SNGLKUP and RES_SNGLKUPREOP.
We’re now very close to the source of the problem!
A hack that bites
So what could possibly set these flags? Turns out the send_dg() function
does:
 999                   {
1000                     /* There are quite a few broken name servers out
1001                        there which don't handle two outstanding
1002                        requests from the same source.  There are also
1003                        broken firewall settings.  If we time out after
1004                        having received one answer switch to the mode
1005                        where we send the second request only once we
1006                        have received the first answer.  */
1007                     if (!single_request)
1008                       {
1009                         statp->options |= RES_SNGLKUP;
1010                         single_request = true;
1011                         *gotsomewhere = save_gotsomewhere;
1012                         goto retry;
1013                       }
1014                     else if (!single_request_reopen)
1015                       {
1016                         statp->options |= RES_SNGLKUPREOP;
1017                         single_request_reopen = true;
1018                         *gotsomewhere = save_gotsomewhere;
1019                         __res_iclose (statp, false);
1020                         goto retry_reopen;
1021                       }
Now, I don’t believe the relevant nameservers have such a bug. Rather, what
seems to be happening is that when the VPN connection drops, making the servers
inaccessible, we hit this path. And these flags are treated by maybe_init() as
if the client application set them, and has thus diverged from the static
configuration. As the application itself has no control over these options being
set like this, this seemd like a real glibc bug.
The fix
I originally reported this to the list back in
March;
I was not confident in my analysis but the maintainers confirmed the
issue. More recently,
they fixed
it.
The actual fix was pretty simple: apply the workaround flags to
statp->_flags instead, so they don’t affect the logic in maybe_init().
Thanks DJ Delorie!
I intentionally have mouse support disabled in vim, as I find not being able to
select text the same way as in any other terminal screen unergonomic.
However, this has an annoying problem as a libvte / gnome-terminal user: the
terminal, on switching to an “alternate screen” application like vim that has
mouse support disabled, “helpfully” maps scroll wheel events to arrow up/down
events.
This is possibly fine, except I use the scroll wheel click as middle-button
paste, and I’m constantly accidentally pasting something in the wrong place as a
result.
This is unfixable from within vim, since it only sees normal arrow key
presses (not ScrollWheelUp and so on).
However, you can turn this off in libvte, by the magic escape sequence:
echo -ne '\e[?1007l'
Also known as XTERM_ALTBUF_SCROLL. This is mentioned in passing in this
ticket.
Documentation in general is - at best - sparse, but you can always go to the
source.
As I mentioned in my last
post, I’ve been
experimenting with replacing davmail with Simon Robinson’s super-cool
email-oauth2-proxy, and
hooking fetchmail and mutt up to it. As before, here’s a specific rundown of
how I configured O365 access using this.
Configuration
We need some small tweaks to the shipped configuration file. It’s used for both
permanent configuration and acquired tokens, but the static part looks something
like this:
[[email protected]]
permission_url = https://login.microsoftonline.com/common/oauth2/v2.0/authorize
token_url = https://login.microsoftonline.com/common/oauth2/v2.0/token
oauth2_scope = https://outlook.office365.com/IMAP.AccessAsUser.All https://outlook.office365.com/POP.AccessAsUser.All https://outlook.office365.com/SMTP.Send offline_access
redirect_uri = https://login.microsoftonline.com/common/oauth2/nativeclient
client_id = facd6cff-a294-4415-b59f-c5b01937d7bd
client_secret =
We’re re-using davmail’s client_id again.
Updated 2023-10-10: emailproxy now supports a proper headless mode, as
discussed below.
Updated 2022-11-22: you also want to set
delete_account_token_on_password_error
to False: otherwise, a typo will delete the tokens, and you’ll need to
re-authenticate from scratch.
We’ll configure fetchmail as follows:
poll localhost protocol IMAP port 1993
 auth password username "[email protected]"
 is localuser here
 keep
 sslmode none
 mda "/usr/bin/procmail -d %T"
 folders INBOX
and mutt like this:
set smtp_url = "smtp://[email protected]@localhost:1587/"
unset smtp_pass
set ssl_starttls=no
set ssl_force_tls=no
When you first connect, you will get a GUI pop-up and you need to interact with
the tray menu to follow the authorization flow. After that, the proxy will
refresh tokens as necessary.
Running in systemd
Here’s my service file I use, slightly modified from the upstream’s README:
$ cat /etc/systemd/system/emailproxy.service
[Unit]
Description=Email OAuth 2.0 Proxy

[Service]
ExecStart=/usr/bin/python3 /home/localuser/src/email-oauth2-proxy/emailproxy.py --external-auth --no-gui --config-file /home/localuser/src/email-oauth2-proxy/my.config
Restart=always
User=joebloggs
Group=joebloggs

[Install]
WantedBy=multi-user.target
Headless operation
Typically, only initial authorizations require the GUI, so you could easily do
the initial dance then use the above systemd service.
Even better, with current versions of email-oauth2-proxy, you can operate in
an entirely headless manner! With the above --external-auth and --no-gui
options, the proxy will prompt on stdin with a URL you can copy into your
browser; pasting the response URL back in will authorize the proxy, and store
the necessary access and refresh tokens in the config file you specify.
For example:
$ sudo systemctl stop emailproxy

$ python3 ./emailproxy.py --external-auth --no-gui --config-file /home/localuser/src/email-oauth2-proxy/my.config

# Now connect from mutt or fetchmail.

Authorisation request received for [email protected] (external auth mode)
Email OAuth 2.0 Proxy No-GUI external auth mode: please authorise a request for account [email protected]
Please visit the following URL to authenticate account [email protected]: https://login.microsoftonline.com/common/oauth2/v2.0/authorize?client_id=...

Copy+paste or press [↵ Return] to visit the following URL and authenticate account [email protected]: https://login.microsoftonline.com/common/oauth2/v2.0/authorize?client_id=...
then paste here the full post-authentication URL from the browser's address bar (it should start with https://login.microsoftonline.com/common/oauth2/nativeclient):

# Paste the updated URL bar contents from your browser in response:

https://login.microsoftonline.com/common/oauth2/nativeclient?code=...

SMTP (localhost:1587; [email protected]) [ Successfully authenticated SMTP connection - releasing session ]
^C
$ sudo systemctl start emailproxy
Obviously, you’ll need to do this interactively from the terminal, then restart
in daemon mode.
email-oauth2-proxy
If you find the above details useful, consider donating to support Simon’s
sterling work on oauth2-email-proxy.
I previously
described accessing Office365 email (and in particular its oauth2 flow) via
davmail, allowing me to continue using fetchmail, procmail and mutt. As
davmail is java, it’s a pain to have around, so I thought I’d give some
details on how to do this more directly in fetchmail, as all the available
docs I found were a little vague, and it’s quite easy to screw up.
As it happens, I came across a generally better
solution shortly after writing
this post, on which more later.
Fetchmail 7
Unfortunately there is little interest in releasing a Fetchmail version with
oauth2 support - the maintainer is taking a political
stance on not
integrating it - so you’ll need to check out the next branch from git:
cd ~/src/
git clone -b next [email protected]:fetchmail/fetchmail.git fetchmail-next
cd fetchmail-next
./autogen.sh && ./configure --prefix=/opt/fetchmail7 && make && sudo make install
I used the branch as of 43c18a54 Merge branch 'legacy_6x' into next. Given
that the maintainer warns us they might remove oauth2 support, you might need
this exact hash…
Generate a token
We need to go through the usual flow for getting an initial token. There’s a
helper script for this, but first we need a config file:
[email protected]
client_id=facd6cff-a294-4415-b59f-c5b01937d7bd
client_secret=
refresh_token_file=/home/localuser/.fetchmail-refresh
access_token_file=/home//localuser/.fetchmail-token
imap_server=outlook.office365.com
smtp_server=outlook.office365.com
scope=https://outlook.office365.com/IMAP.AccessAsUser.All https://outlook.office365.com/POP.AccessAsUser.All https://outlook.office365.com/SMTP.Send offline_access
auth_url=https://login.microsoftonline.com/common/oauth2/v2.0/authorize
token_url=https://login.microsoftonline.com/common/oauth2/v2.0/token
redirect_uri=https://login.microsoftonline.com/common/oauth2/nativeclient
Replace [email protected] and localuser in the above, and put it at
~/.fetchmail.oauth2.cfg. It’s rare to find somebody mention this, but O365
does not need a client_secret, and we’re just going to borrow davmail’s
client_id - it’s not a secret in any way, and trying to get your own is a
royal pain. Also, if you see a reference to tenant_id anywhere, ignore it -
common is what we need here.
Run the flow:
$ # This doesn't get installed...
$ chmod +x ~/src/fetchmail-next/contrib/fetchmail-oauth2.py
$ # Sigh.
$ sed -i 's+/usr/bin/python+/usr/bin/python3+' ~/src/fetchmail-next/contrib/fetchmail-oauth2.py
$ ~/src/fetchmail-next/contrib/fetchmail-oauth2.py -c ~/.fetchmail.oauth2.cfg --obtain_refresh_token_file
To authorize token, visit this url and follow the directions:
  https://login.microsoftonline.com/common/oauth2/v2.0/authorize?...
Enter verification code:
Unlike davmail, this needs just the code, not the full returned URL, so you’ll
need to be careful to dig out just the code from the response URL (watch out for
any session_state parameter at the end!).
This will give you an access token that will last for around an hour.
Fetchmail configuration
Now we need an oauthbearer .fetchmailrc like this:
set daemon 60
set no bouncemail
poll outlook.office365.com protocol IMAP port 993
 auth oauthbearer username "[email protected]"
 passwordfile "/home/localuser/.fetchmail-token"
 is localuser here
 keep
 sslmode wrapped sslcertck
 folders INBOX
 mda "/usr/bin/procmail -d %T"
Replace [email protected] and localuser.
At this point, hopefully starting /opt/fetchmail7/bin/fetchmail will work!
Refresh tokens
As per the OAUTH2
README,
fetchmail itself does not take care of refreshing the token, so you need
something like this in your crontab:
*/2 * * * * $HOME/src/fetchmail-next/contrib/fetchmail-oauth2.py -c $HOME/.fetchmail.oauth2.cfg --auto_refresh
I have the misfortune of maintaining some things using CMake. One major
annoyance is that __FILE__ is an absolute path, and that can’t be changed in
CMake itself. Like most CMake annoyances, you can find a discussion online from
about 15 years ago, but no sign of an actual fix.
Instead, you need a hack: this - I think - is the simplest one.
First, in our top-level CMakeLists.txt, we’ll define this helper function:
function(add_srcs NAME)
  set(${NAME} ${ARGN} PARENT_SCOPE)
  foreach(f IN LISTS ARGN)
    file(RELATIVE_PATH b ${CMAKE_SOURCE_DIR}
         ${CMAKE_CURRENT_SOURCE_DIR}/${f})
    set_source_files_properties(${f} PROPERTIES COMPILE_DEFINITIONS
                                "__FILE__=\"${b}\"")
  endforeach()
endfunction()
This will take each of the arguments, convert each file into a path relative to
the top-level directory, then re-define __FILE__ on a per-source-file basis.
We also set() a variable for our parent scope to use.
We’ll also need -Wno-builtin-macro-redefined.
Then, in each child CMakeLists.txt, we will do something like:
add_srcs(MYCODE_SRCS mycode.c mycode.h)
add_library(mycode ${MYCODE_SRCS})

add_srcs(CODE2_SRCS code2.c code2.h)
add_library(code2 ${CODE2_SRCS})
I thought it might be interesting, at least to myself, to write up how I
approach code reviews. My history in tech is one where close code review was
emphasized and well-respected: most appreciated that a detailed review was not
only worth the reviewer’s time, but mutually beneficial, and often a great
learning experience for everyone. So my tiny mind can’t process ideas like
post-commit
reviews,
that seem to be predicated on the idea that testing is some kind
of replacement for code review. To me, the kind of things that tests can cover
is only a very small part of what code review is useful for.
I’ve code-reviewed entire projects totalling many thousands of lines, and
single-character changes, but I’m usually following at least some of the below
patterns either way:
Understand the context
First thing I read is the commit message. Of course, this should be in normal
form, but I’m really making sure I can understand
what the change is, based solely upon the commit message. Without looking at the
code, can I, as a casual observer, understand what’s changed? Is the commit
title specific enough? Does the commit message’s contents describe not just
what changed, but why (as usual, the GNU standard is an exemplar of what not
to do here)? Is it clear? Does the message needlessly have things that belong on
another tracking system (target gate)?
I will read any associated ticket for its context - especially keeping an eye
out for anything that doesn’t seem to fit with the PR’s changes. This could be a
missing case, or a fundamental mis-understanding of what the real underlying
problem is. If there is any design doc mentioned (and they should be mentioned!)
I’ll also read that and diff its contents against what actually got
implemented.
I’m looking mainly for disparities between what everyone agreed we should do,
and what is actually happening in the code, but especially for missing things;
it’s very easy to accidentally skip somebody’s drive-by comment, but that could
turn out to be crucial to the implementation.
I also consider if this change makes sense on its own, and if it could be split
up: this is often a matter of appetite (and personally I find the Linux kernel
approach often goes a little too far), but patch series with one logical change
per commit is often much easier to review. It should hopefully go without saying
that each individual commit in the series should still pass CI, but
unfortunately that’s painful to do with at least github
PRs.
Get an overview
Next I start looking at the actual code changes: often with one tab per
file,
I’m trying to understand how the changes fit together: who calls what, what new
intra-code dependencies there are, what the possible impact of the changes could
be.
I might well look back in git history for each of these files to understand why
the old code is like it is: this is also often very useful in identifying
potential issues with the new changes.
Depending on the change, I will often checkout a local copy, and use git grep,
ctags, etc. to help me understand how everything fits together.
My focus at this level is often on interfaces: does a new method have a suitable
name? Is it at the right level of abstraction? What is the ownership of the
relevant objects? Are there any layering violations?
Are there any external dependencies we need to worry about? Equally if anyone is
depending on us, are we providing well-written interfaces? Are they designed
with care and attention to versioning, information hiding, and all the usual API
concerns? Is this going to wear well after it’s been in production for years?
I’m also bearing in mind other ongoing work: if there’s a project underway that
is directly relevant to this specific change, I might ask for some accommodation
that will make the eventual merge of both easier. Equally if there’s a general
desire to take a particular technical direction, I might complain if something
is taking a different tack.
It’s a rare code review where I don’t have to pause to go research something:
systemd service definition semantics, syscall error modes, how selinux roles
work etc. As I said above, great learning experience!
Are there potential performance concerns with the change: lots of unnecessary
I/O, potential for big-O issues, needless overhead etc? What are the expected
limits of the objects being handled?
What if there are bugs with this change: is the error handling suitable? Is
there a sufficient level of logging, exception details, etc. to identify in the
field what went wrong? Is there unnecessary noise? How would a stressed-out SRE
deal with this in production?
Have any necessary unit/component tests been updated or added? Do they actually
test something useful?
I almost never build or test changes I’m reviewing: that’s a job for the
submitter and your CI infrastructure. The only exception is if I’m struggling to
understand something, and running the tests would help.
Detailed review
I’m now going to go line-by-line through the whole patch, leaving comments where
necessary. Sometimes I’ll reach something I don’t understand, add leave a
“FIXME” for myself: if, after reading the whole change, I still don’t understand
what’s happening, this will often re-formulate itself into a question for the
submitter, along with a request for expanded code comments, but usually I can
just delete these later.
If I find major - architectural level - issues with what I’m looking at, that’s
often a good prompt to take the discussion elsewhere, perhaps to a Zoom call or
design document discussion. Doing design review inside a PR is not fun for
anyone.
I’ve noticed a tendency to “review the diffs”: the idea that only the changed
lines are relevant to the review - that tools expand 10 lines at a time is a
symptom of this. This is very wrong-headed in my opinion, and I often find
myself in the rest of the code to make sure I can properly review what has
changed.
Comb for nits
Everyone has a different appetite for code review nits: generally, I will always
point out actual typos (often just once, if it’s repeated, expecting the
submitter to apply my comment to all instances). If I have a substantive
comment, I might also suggest some style-level improvements. I never expect
someone to make these sort of changes for existing code: the general idea is to
leave the code in a slightly better place than it was, not re-write whole files
for cosmetic nits.
Often these stylistic nits are marked “optional”: if the submitter feels like
it, they could change it, but it’s no big deal if not.
I’ll very often have style comments on things like:
- unnecessary comments that just describe the code
- missing comments
- variable, function naming
- function size and decomposition
- local customs
Many of these things can be a matter of opinion, so I try to bear in mind other
ways of thinking, up to a point. I’m never going to be happy seeing a ton of
CamelCase and Hungarian notation in code that doesn’t have it already.
Iterate
I haven’t yet found a code review tool that’s ideal at iteration: gerrit is
still pretty hopeless at tracking outstanding comment state. PRs in github are
better at displaying this, but have the fatal flaw that any history rewrite
means all context is lost.
Regardless, when I get a new version of the changes, I’ll often review both the
incremental diff and the whole change, checking that:
- my review comments have been acted upon and the fixes look good
- the change as a whole still makes sense:
- is the commit message still correct?
- are there now unnecessary changes, due to follow-on fixes?
- do the updates go far enough?
Long review cycles for a PR can be grueling, both for reviewers and the PR
owner. But in my opinion it’s almost always worth the effort, especially for
complex changes: this code is
probably going to live a lot longer than you’d think, and be maintained by
people other than you.
Even worse, it’s often work not given the respect it’s due: PR owners can see it
as a combative process, and management can see it as overhead. I don’t really
know what to do about that.
Pay it forward!
It’s still common for a systems library to be written in the default lingua
franca, C, although Rust is encroaching, for good reasons.
However, when it comes to testing, things get tedious quickly: writing unit or
component tests in C is a slow, bug-prone exercise. With
libvfio-user, after fixing too many
bugs that were due to the test rather than the test subject, I decided it would
be worth looking at alternative approaches. The aim was to reduce the time it
takes to develop unit/component tests.
Up until this point, we’d been using
ctest, along with
cmocka when we needed to mock out certain functions (such
as socket handling). Leaving aside my strong feelings on these tools, this was
rather unsatisfactory: libvfio-user effectively implements a (UNIX) socket
server, but we weren’t actually testing round-trip interactions for the most
part. In terms of code coverage, very little useful could be done via this unit
testing approach, but the “sample” client/server was tedious to work with for
testing purposes.
Python-based testing
After a quick proof of concept, it became clear that using Python would be a
great choice to cover most of our testing needs. libvfio-user doesn’t ship
with any client bindings, and, given that the main clients are
qemu,
cloud-hypervisor and
SPDK, Python bindings would be of dubious utility.
As a result, we decided against “proper” Python bindings, auto-generated or
otherwise, in favour of a small and simple approach. In particular, by using the
terrible magic of ctypes, we could easily set up both client and server test
cases that fully represent how the library works in real life.
So, instead of auto-generated bindings, we write - by hand -
simple, thin, layers of
type wrappers:
class vfio_irq_info(Structure):
    _pack_ = 1
    _fields_ = [
        ("argsz", c.c_uint32),
        ("flags", c.c_uint32),
        ("index", c.c_uint32),
        ("count", c.c_uint32),
    ]
small harness routines for socket handling
…
def connect_client(ctx):
    sock = connect_sock()

    json = b'{ "capabilities": { "max_msg_fds": 8 } }'
    # struct vfio_user_version
    payload = struct.pack("HH%dsc" % len(json), LIBVFIO_USER_MAJOR,
                          LIBVFIO_USER_MINOR, json, b'\0')
    hdr = vfio_user_header(VFIO_USER_VERSION, size=len(payload))
    sock.send(hdr + payload)
    ...
… interacting with the
library on the server
side
…
def get_pci_header(ctx):
    ptr = lib.vfu_pci_get_config_space(ctx)
    return c.cast(ptr, c.POINTER(vfu_pci_hdr_t)).contents
… and so on. Writing this by hand might seem immensely tedious, but in practice,
as it’s pretty much all boilerplate, it’s very quick to write and modify, and
easily understandable; something that can rarely be said for any kind of
auto-generated code.
Client/server interactions
Another observation was that, for the purposes of these tests, we really didn’t
need a client process and a server process: in fact, we don’t even need more
than one thread of execution. If we make each test round-robin between acting as
the client, then acting as the server, it becomes trivial to follow the
control flow, and understanding logs, debugging, etc. is much easier. This is
illustrated by the
msg()
helper:
def msg(ctx, sock, cmd, payload=bytearray(), expect_reply_errno=0, fds=None,
        rsp=True, expect_run_ctx_errno=None):
    """
    Round trip a request and reply to the server. vfu_run_ctx will be
    called once for the server to process the incoming message,
    @expect_run_ctx_errrno checks the return value of vfu_run_ctx. If a
    response is not expected then @rsp must be set to False, otherwise this
    function will block indefinitely.
    """
    # FIXME if expect_run_ctx_errno == errno.EBUSY then shouldn't it implied
    # that rsp == False?
    hdr = vfio_user_header(cmd, size=len(payload))

    if fds:
        sock.sendmsg([hdr + payload], [(socket.SOL_SOCKET, socket.SCM_RIGHTS,
                                        struct.pack("I" * len(fds), *fds))])
    else:
        sock.send(hdr + payload)

    ret = vfu_run_ctx(ctx, expect_errno=expect_run_ctx_errno)
    if expect_run_ctx_errno is None:
        assert ret >= 0, os.strerror(c.get_errno())

    if not rsp:
        return

    return get_reply(sock, expect=expect_reply_errno)
We are operating as the client when we do the sendmsg(); the server then
processes that message via vfu_run_ctx(), before we “become” the client again
and receive the response via get_reply().
We can then implement an individual test like this:
def test_dma_region_too_big():
    global ctx, sock

    payload = vfio_user_dma_map(argsz=len(vfio_user_dma_map()),
        flags=(VFIO_USER_F_DMA_REGION_READ |
               VFIO_USER_F_DMA_REGION_WRITE),
        offset=0, addr=0x10000, size=MAX_DMA_SIZE + 4096)

    msg(ctx, sock, VFIO_USER_DMA_MAP, payload, expect_reply_errno=errno.ENOSPC)
which we can run via make pytest:
...
___________________________ test_dma_region_too_big ____________________________
----------------------------- Captured stdout call -----------------------------
DEBUG: quiescing device
DEBUG: device quiesced immediately
DEBUG: adding DMA region [0x10000, 0x80000011000) offset=0 flags=0x3
ERROR: DMA region size 8796093026304 > max 8796093022208
ERROR: failed to add DMA region [0x10000, 0x80000011000) offset=0 flags=0x3: No space left on device
ERROR: msg0x62: cmd 2 failed: No space left on device
...
This is many times easier to write and test than trying to do this in C, whether
as a client/server, or attempting to use mocking. And we can be reasonably
confident that the test is meaningful, as we are really executing all of the
library’s message handling.
With a little bit of tweaking, we can also use standard C-based tools like
valgrind and gcov. Code coverage is simple: after defeating the mini-boss of
cmake, we can run make gcov and get code-coverage results for all C code
invoked via the Python tests - it just works!
Running Python tests with valgrind was a little harder: for leak detection, we
need to make sure the tests clean up after themselves explicitly. But Python
itself also has a lot of valgrind noise. Eventually we found that this valgrind
invocation worked well:
	PYTHONMALLOC=malloc \
	valgrind \
	--suppressions=$(CURDIR)/test/py/valgrind.supp \
	--quiet \
	--track-origins=yes \
	--errors-for-leak-kinds=definite \
	--show-leak-kinds=definite \
	--leak-check=full \
	--error-exitcode=1 \
	$(PYTESTCMD)
We need to force Python to use the system allocator, and add a number of
suppressions for internal Python valgrind complaints - I was unable to find a
working standard suppression file for Python, so had to construct this myself
based upon the Python versions in our CI infrastructure.
Unfortunately, at least on our test systems, ASAN was completely incompatible,
so we couldn’t directly run that for the Python tests.
Summary
The approach I’ve described here has worked really well for us: it no longer
feels immensely tedious to add tests along with library changes, which can only
help improve overall code quality. They are quick to run and modify, and for the
most part easy to understand what the tests are actually doing.
There’s been a few occasions where ctypes has been difficult to work with -
for me the documentation is particularly sparse, and callbacks from the C
library into Python are distinctly non-obvious - but we’ve so far always
managed to battle through, and twist it to our needs.
Doing things this way has a few other drawbacks: it’s not clear, for example, how we might test
intermittent allocation failures, or other failure injection scenarios. It’s
also not really suitable for any kind of performance or scalability testing.
I’m curious if others have taken a similar approach, and what their experiences
might be.
Stefan Hajnoczi recently posted about clean commit
history.
It’s a controversial viewpoint that not everyone agrees with - there is a
sizable population in favour of “never rewrite history”. For me, though, the
points he makes there are totally correct: each commit should be a logical
change, main (neé master) should stay green, and CI should pass at every
single point in main’s history. More than just CI though: regardless of
whether it passes CI, the main branch should be of good quality at all times,
if you want to avoid the Quality Death
Spiral.
Unfortunately, Github pull requests make this model a little difficult for a few
reasons:
You can’t ever rebase a PR undergoing review
It’s important that a non-draft PR is never rebased, or re-written in any way.
Why? Well, aside from making it difficult for a reviewer to see what’s changed
since last looking, if you rebase, the commits previously on the PR disappear
off into reflog
hyperspace.
The View Changes button on review comments is attached to that particular
commit hash, which is no longer in the history for that branch, and you get the
dreaded:
We went looking everywhere, but couldn’t find those commits.
Note that if your PR is still a draft, you’re fine to edit the history whichever
way you like: in fact, it’s often useful for review purposes to have multiple
commits even at the start of a PR review before you move it from draft. Up to you.
The only other safe time to rebase is on final approach. At that point,
presuming you are keeping to the “single main commit per PR” approach (see
below), you’ll be wanting to squash the entire branch history into a single
commit to main. For this, I usually use
prr: it’s handy for picking up Reviewed-by
automatically, and merging commit comments together for final editing.
Github CI only runs on branch tips
You probably don’t want to have a PR where you’re going to merge more than
one commit into main. This is because CI only runs on the top-level commit: if
an ancestor commit breaks the build, you’ll never know. Stefan mentions using
git rebase --exec for checking commits in a stack, which indeed works great,
but unless you’re running exactly the same CI that’s running under Github
Actions, you can’t rely on it.
If that’s the case, what if you have one or more changes that depend on another?
This is where “stacked PRs” come in, and they’re a bit of a pain…
Stacked PRs are cumbersome
Gerrit has a really useful model for
reviewing stacks of changes: instead of the full history, each “patchset”
corresponds to the single logical change Stefan talks about above. Every time
you push to Gerrit, you’re supposed to have collapsed and rebased additional
changes into single commits corresponding to each Gerrit CR. The model has some
disadvantages as well (in particular, it’s a bit of a pain to keep a full
history locally), but the Gerrit review UI doesn’t suffer from the rebasing
issues Github does.
Presuming - as there is no CI available - gerrithub is a
non-starter, the only option available on Github is to use multiple PRs. This is
better than it used to be, but is still a little painful.
Essentially, a stacked PR is one that’s opened not against the main branch,
but against another PR branch. Say we have changes A and B, where B is
dependent on A. You’d create a local branch with A, then push it to Github
and open a PR. You’d have another local branch with A and B, then push
that branch to Github and open a separate PR.
Now we need to make the B PR be based against the A PR. You can do this via
the web UI by clicking Edit, though there is annoying bug here: it doesn’t
reset the title and description. You can use gh pr create --base ... to avoid
this problem.
Now, in the second PR, you’ll just see the commit for B. Each PR can be
reviewed separately, and each PR gets its own CI run.
You also might want to merge additional changes up the stack. Let’s say that you
have commit A2 on the A PR, that you want in PR B and C: the best - if
rather tedious - way to do this, is to merge A into B, then B into C.
That’s a lot of merge commits, but remember we’re squashing a PR every time
before merging a PR to main.
You’ll see on the web recommendations to “merge downwards”: you wait for commit
approval for the whole stack, then merge the top PR (B) into the PR underneath
it (A), and so on, until you merge to main.
I don’t think that’s necessary these days. Instead, when you have approval for
the base PR - and logically, it will make sense that is reviewed first - you can
merge it to main. Github will then offer to delete the PR branch. If you do
this, the stacked PR gets automatically reset such that its merge base is now
main !
There is an annoying thing here though: because of that squash during the merge
to main, git, and Github, needs you to merge main back into the commit
history of the PR that just changed bases. If you already merged the parent PR,
you can always do git merge -Xours master to fix this, since there shouldn’t
be any actual diff difference between the PR branch diffs as a whole, and what
was merged to master. Or, if you didn’t merge in the parent PR, you’ll need a
normal git merge master.
Another bug (as far as I’m concerned) is that if you ask for review on a stacked
PR, it doesn’t get tagged with “Review required”, since, technically, you could
merge the PR into its parent without approval. And there is no “Review
requested” tag.
I would love all this to have some tooling: something that lets me do
everything on my local stacked branches, automate merges up, keep track of
dependencies, and updating the branches in Github. But I haven’t been able to
find anything that can do it.
[2022-05-12 update]: I just came across spr
which is so far proving excellent in solving some of these problems. I love it!
For reasons, I now need to interact with Office365 mail and calendar. It should
go without saying that the Outlook webapp is almost painfully unusable (there
really is no key binding for “next unread email”). Thus began the quest to get
mutt interacting with the O365 server. This was a rather painful process: so
much of the information on the web refers to earlier authentication schemes,
Microsoft-special protocols, things that don’t support 2FA, dead Linux software,
useless Linux software, etc.
After many false starts, I eventually found a working solution that allows mutt
usage (and my treasured key binding for “mark current thread as read and move to
the next unread email”). That solution is
davmail. Yes, it’s on sourceforge, and yes,
it’s Java, but it works perfectly.
It’s not very well-documented, but you can run it in headless mode and still
do the interactive OAuth2 flow needed with modern O365. Your settings should
include:
davmail.mode=O365Manual
davmail.url=https://outlook.office365.com/EWS/Exchange.asmx
When davmail starts, it will ask you to visit a URL and paste the resulting URL
back - this contains the necessary OAuth2 tokens it needs. No need for any GUI!
Once davmail is running, your .fetchmailrc can be:
poll localhost protocol IMAP port 1143
 auth password username "[email protected]"
 is localuser here
 sslmode none
 keep
 mda "/usr/bin/procmail -d %T"
 folders INBOX,etc,etc
Note that since davmail is running locally, there’s not really any need for SSL,
though you can set that up if you like.
When you start fetchmail, enter your password, and that will initiate the auth
flow against the davmail instance. Note that you’re not storing passwords
anywhere, unlike the old-style app password approach you might have used
previously on gmail and the like.
I don’t need to send mail often, so I have mutt set up like this:
set smtp_url= "smtp://[email protected]@localhost:1025/"
unset smtp_pass
set ssl_starttls=no
set ssl_force_tls=no
Having to enter my password each time is not a big deal for me.
Equally I have my calendar app set up to pull over caldav from davmail. Works
great. I’d love to be able to pull my O365 calendar into Google Calendar, but
apparently Google and Microsoft are unable - or more likely unwilling - to
make this work in any meaningful way.
I’m pretty sure it’s possible to adapt Google’s OAuth2 scripts to directly use
fetchmail with O365’s modern auth stuff, but I’m not sure I have the energy to
figure it out - and as far as I can find, nobody else has?